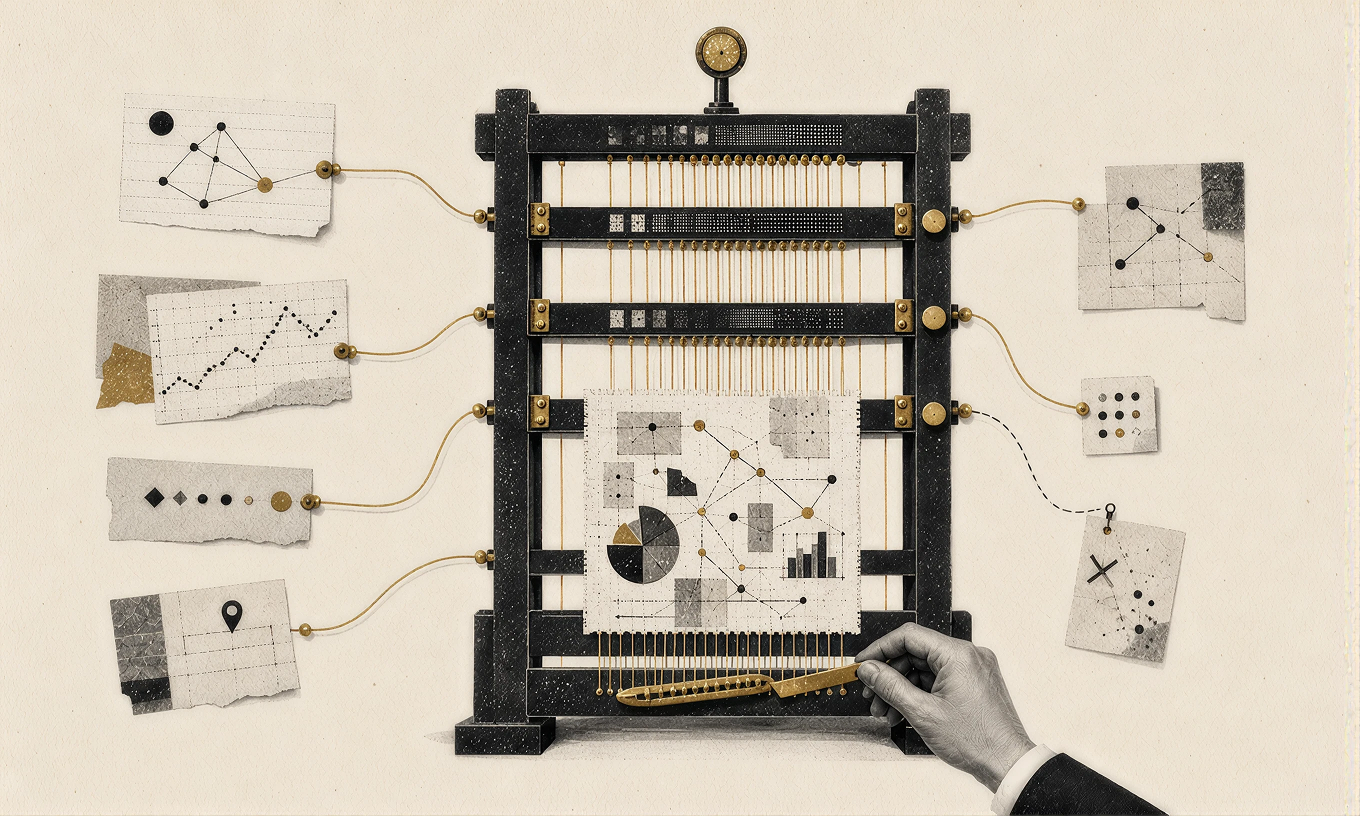
How Cross-Object Evidence Binding Makes Statistical Significance Review Traceable
OCR can find "significant" and a P-value. A review system must determine whether they refer to the same endpoint, comparison, and analysis.
A presentation slide is not a flat block of text.
It is a spatial document composed of titles, text boxes, charts, legends, tables, symbols, captions, footnotes, references, and images. A statistical-significance claim may appear in the title, while the endpoint is named in a chart label, the comparison is encoded by two colored curves, an asterisk points to a footnote, and the P-value appears at the bottom of the page.
OCR can extract the strings. Regular expressions can find P=0.002. A language model can summarize the page.
But a review system has to solve a harder problem: Does this P-value support this claim for this endpoint and this comparison?
That requires cross-object evidence binding.
Why token detection is not enough
Suppose a slide contains the headline "Significantly reduced the risk of disease progression" and a Kaplan–Meier chart. The page also contains an asterisk near one curve and *P<0.05 in a footnote.
A text-only pipeline may produce four correct observations:
- the word "significantly" is present;
- a P-value expression is present;
- a hazard ratio appears in a table;
- two treatment groups are shown.
It can still reach the wrong conclusion.
The P-value may belong to a secondary endpoint. The asterisk may mark a time-point comparison rather than the overall curve comparison. The hazard ratio may use a different analysis population. The headline may overgeneralize a subgroup result. Or the visible P<0.05 may be a template note not connected to the displayed analysis.
Finding the right tokens is a retrieval task. Proving their relationship is a reasoning and data-modeling task.
A four-stage evidence-chain architecture
A practical technical architecture separates the work into four stages: structure parsing, claim-intent capture, evidence extraction, and relational closure.
1. Structure parsing: reconstruct the page as objects
The first stage converts the source presentation into a document-native representation.
For each page, the system can preserve:
- object type: title, body text, chart, table, shape, image, note, or reference;
- object coordinates and visual hierarchy;
- reading order and grouping;
- text style, superscripts, symbols, and callout lines;
- chart titles, axis labels, legends, data tables, and captions;
- footnote markers and corresponding footnote regions;
- source page and source-file identifiers.
OCR remains useful for text embedded in screenshots or flattened images, but it should not erase layout. A string extracted from the bottom margin has a different evidentiary role from the same string in a headline.
The result is not just text. It is a semantic map of the page.
2. Claim-intent capture: identify what the material is asserting
The second stage identifies candidate claims and normalizes their intent.
A significance-related claim object may include:
{
  "claim_text": "significantly reduced the risk of disease progression",
  "claim_type": "statistical_significance",
  "endpoint": "progression-free survival",
  "population": "unresolved",
  "comparison": "treatment_vs_control",
  "direction": "benefit",
  "source_object": "slide_12.title_1"
}
The system should distinguish explicit statistical language from descriptive language. "Statistically significant improvement" is a direct trigger. "The curve remained higher during follow-up" may be a descriptive observation and should not automatically require the same evidence path.
This trigger classification is important for precision. A system that treats every number as a significance claim creates noise and loses reviewer trust.
3. Evidence extraction: preserve provenance
The third stage extracts candidate evidence without prematurely deciding that it proves the claim.
Evidence objects can include:
- P-value text and operator;
- effect estimate, such as hazard ratio, risk ratio, odds ratio, or mean difference;
- confidence-interval limits and level;
- endpoint and time-point labels;
- treatment and comparator names;
- analysis population;
- chart marker or asterisk;
- footnote text;
- reference citation or source document;
- qualifiers such as nominal, adjusted, exploratory, post hoc, or subgroup.
Every item should retain provenance: page, object, bounding box, extraction method, and source text. A reviewer must be able to navigate from a finding back to the exact visual location.
For example:
{
  "evidence_type": "p_value",
  "value": "<0.05",
  "source_object": "slide_12.footnote_2",
  "marker": "*",
  "bounding_box": [0.08, 0.91, 0.16, 0.95],
  "extraction_method": "native_text"
}
4. Relational closure: connect claim and evidence
The fourth stage is where retrieval becomes review.
The system creates candidate relationships between claim and evidence objects, then evaluates them using multiple signals:
- Explicit reference: matching asterisk, superscript, figure number, table number, or citation.
- Semantic consistency: same endpoint, comparison, population, direction, and time point.
- Spatial relationship: proximity, alignment, containment, callout line, or shared visual group.
- Document hierarchy: title-to-chart, caption-to-figure, or footnote-to-table relationship.
- Statistical compatibility: the metric and model are plausible for the claim being made.
- Source consistency: the cited reference and analysis context support the same result.
- Conflict signals: multiple candidate P-values, unresolved populations, contradictory directions, or missing endpoint labels.
The output can be modeled as a graph: claim and evidence objects are nodes, and supported relationships are edges. The claim is review-ready only when the required edges form a sufficiently complete and inspectable chain.
Proximity can generate a candidate edge. It should not be treated as proof by itself.
Blocking false proof, not just missing evidence
An evidence-chain engine must detect more than absence. It should also recognize evidence that looks persuasive but does not support the asserted conclusion.
Useful blocking patterns include:
Numeric-only pseudo-proof
The material says "significant improvement" and shows 1% versus 10%, but no inferential result is linked to the comparison. The system should not infer statistical significance from the size of a visible difference.
Misbound evidence
A P-value is present, but it resolves to another endpoint, subgroup, time point, or comparison. A same-page match should be rejected when semantic identifiers conflict.
Incomplete context
An effect estimate is found, but the reference group, interval limits, analysis population, or endpoint cannot be resolved. The output should describe what is missing rather than manufacture certainty.
Valid non-trigger
The material makes no statistical-significance claim and uses neutral descriptive language. The system should avoid forcing a P-value requirement solely because a chart contains numbers.
These patterns improve precision because the engine asks two separate questions: Was evidence found? And is that evidence valid for this claim?
Structured output for two audiences
The same decision must serve both technical operators and business reviewers.
The machine-readable layer can preserve detailed reasoning:
{
  "review_point": "statistical_significance_claim",
  "claim": "significantly improved overall survival",
  "claim_object": "slide_18.title_1",
  "evidence_status": "incomplete",
  "p_value": null,
  "effect_estimate": "HR=0.85",
  "confidence_interval": "unresolved",
  "binding_status": "no_supporting_p_value_bound_to_claim",
  "risk_level": "high",
  "confidence_band": "high",
  "next_action": "verify_source_or_revise_claim"
}
The reviewer-facing layer should translate that structure into a concise explanation:
The headline claims a statistically significant improvement in overall survival. An HR of 0.85 was found in the chart, but no P-value or complete confidence interval was reliably linked to the same endpoint and comparison. Verify the cited analysis or revise the claim before formal MLR approval.
The two layers should remain synchronized. Technical teams need provenance, rule identifiers, and confidence signals. Reviewers need the claim, evidence, gap, clinical interpretation, and next action in plain language.
Confidence is not a verdict
Confidence can indicate how strongly the system believes it has parsed or bound an object. It cannot turn incomplete evidence into a compliant claim.
A high-confidence output may state that the system is highly confident no supporting P-value was found in the parsed material. It does not prove that no valid evidence exists in an external source or that the material is legally noncompliant in every intended market.
For that reason, production output should separate:
- extraction confidence;
- relation or binding confidence;
- rule outcome;
- unresolved evidence;
- recommended human action.
Confidence should help prioritize review, not replace accountable judgment.
Evaluation should test relationships, not only text extraction
OCR accuracy is necessary but insufficient. A technical evaluation should test the full evidence chain.
Useful measures include:
- claim-trigger precision and recall;
- P-value, effect-estimate, interval, endpoint, and population extraction accuracy;
- footnote-marker resolution accuracy;
- claim-to-evidence binding precision and recall;
- false-binding rate across multiple endpoints or subgroups;
- correct non-trigger rate for descriptive statements;
- evidence-provenance completeness;
- page and object localization accuracy;
- human agreement and override reasons;
- latency, throughput, and stability across native and flattened presentations.
Test sets should include hard negatives: pages where the claim and P-value coexist but do not belong together, pages with only numerical contrasts, charts whose supporting statistic sits in a footnote, and slides with more than one endpoint.
Human-reviewable by design
Qualified reviewers should be able to inspect the original page, highlight the claim object, open the linked evidence objects, see why each relationship was proposed, reject an incorrect binding, and record the reason.
That feedback can improve rule configuration, prompt evaluation, extraction models, and test coverage. More importantly, it preserves the accountability boundary: the system organizes evidence and identifies gaps; the reviewer interprets the source, applicable SOP, statistical context, and permitted wording before formal MLR approval.
From OCR output to an evidence graph
The technical leap is not better keyword matching. It is representing a presentation as claims, evidence objects, and reviewable relationships.
Structure parsing tells the system where information lives. Intent capture tells it what is being asserted. Evidence extraction preserves the statistics and their provenance. Relational closure determines whether the pieces belong together.
That is how an AI-assisted review system moves from "I found a P-value" to "Here is the evidence chain, here is the unresolved gap, and here is what a human reviewer should verify next."
This article focuses on the technical architecture for binding statistical claims to supporting evidence across complex medical content materials. For specific implementation details, please through our official website.
Approval Is Not the End: Managing Claims Across the MLR Lifecycle
An approved claim can be reused, shortened, localized, or paired with new evidence. The operational risk begins when teams cannot see where it moved or what changed.